📊 Human-centered Data Visualization
- 1 minVisualizing data
Nature: Data visualization design
Type: Individual project
My roles: Literature Reviewer, Designer, Coder
Tools: Python, Procreate, R, Graphviz
Duration: 2 weeks
Background
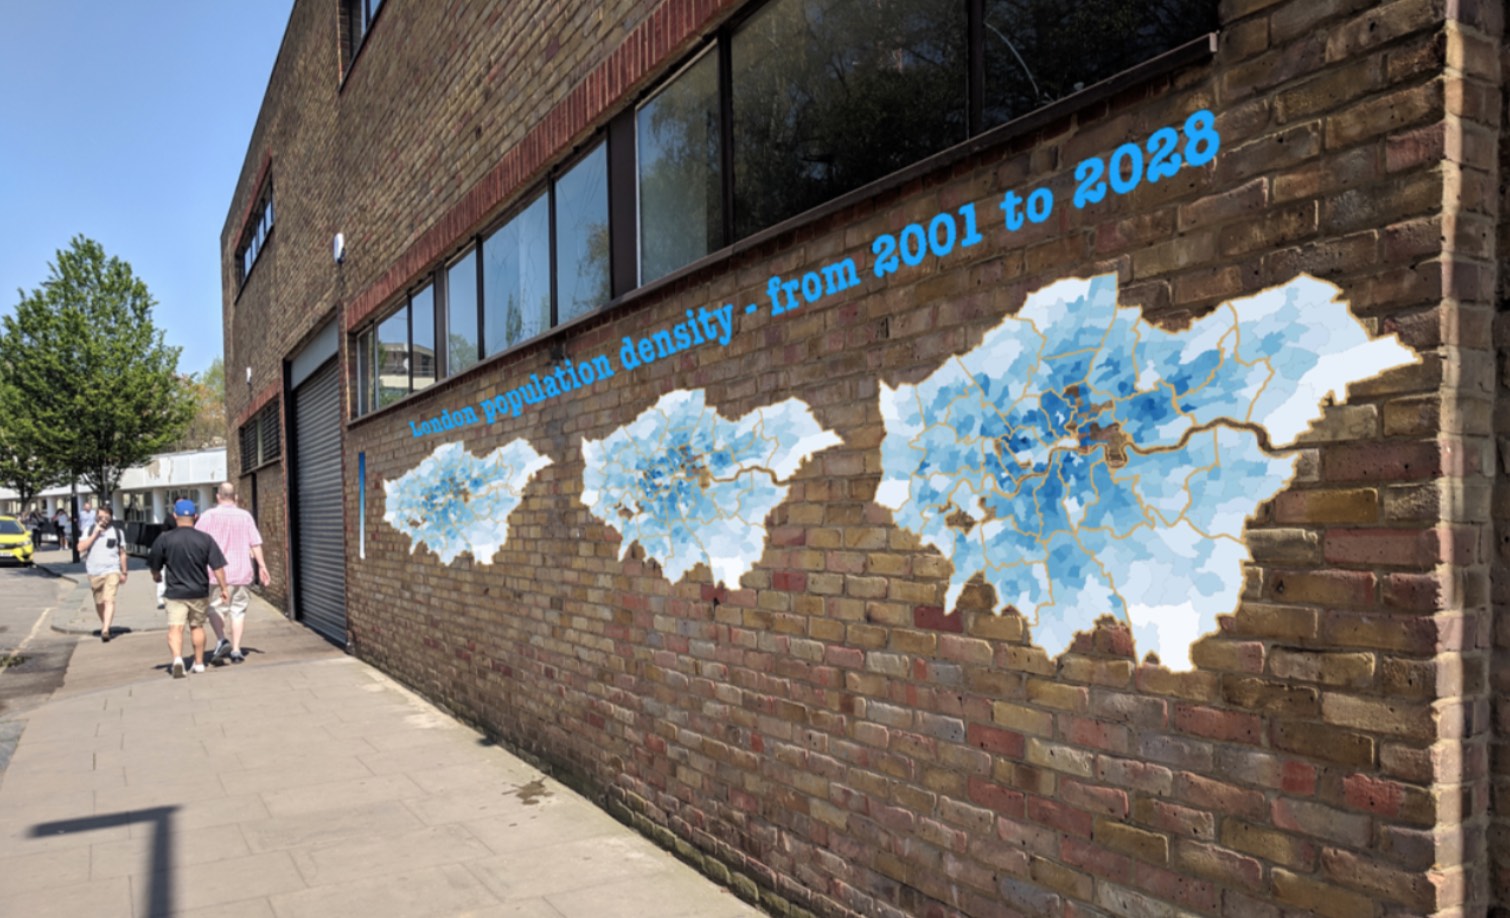
As personal computing power increases, there is an increasing need of understanding data. One way to achieve this is through data visualization - translating columns and rows into human-readable format. This project explores how to visualize data in a way that is compelling to the target audiences. The design was informed by previous literature on information retrieval and human perception principles. The visualization was built with Python (Plotly, Seaborn, matplotlib), R and graphviz. Visual effects by Procreate.